Raymii.org

אֶשָּׂא עֵינַי אֶל־הֶהָרִים מֵאַיִן יָבֹא עֶזְרִֽי׃Home | About | All pages | Cluster Status | RSS Feed
YouLessQt, helps you align the YouLess to an analog electricity meter
Published: 16-9-2023 09:00 | Author: Remy van Elst | Text only version of this article
❗ This post is over two years old. It may no longer be up to date. Opinions may have changed.
Table of Contents
The YouLess is a device that can help you monitor energy usage. It works on so called smart meters using a P1 port, it can monitor solar panels but it also works with regular old analog meters. I have an old style analog meter but I like gadgets and monitoring / reducing my energy usage just as much as the next guy so I bought one. It has an optical sensor that you paste (with tape) on your meter and that detects a little black bar on the rotor disc and using a rpm factor on your meter it calculates the electricity used. I has some trouble with the device when I set it up, it turned out to be aligned wrongly. It sometimes missed the black bar, so the numbers were incorrect. I wrote a little application using Qt and QML to show the raw light sensor values in a line graph to help me align the YouLess correctly. This post tells you more about the application, which of course is open source.
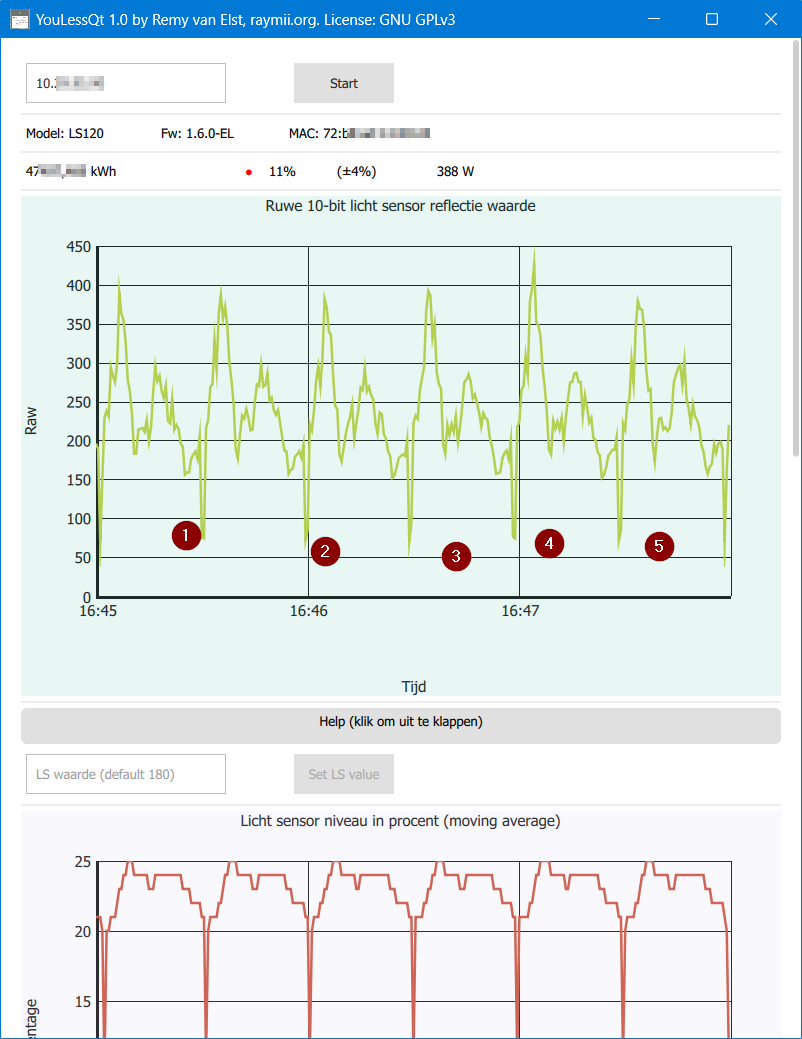
This is a screenshot of the Windows build of YouLessQt. The marked dips in the graph are the light sensor values when a pulse is detected:
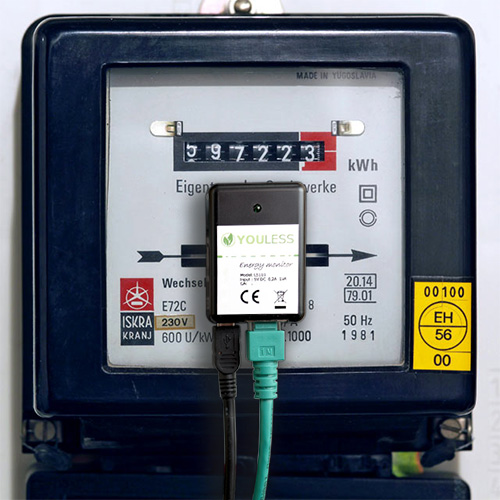
This is a picture of the YouLess attached to an analog meter:
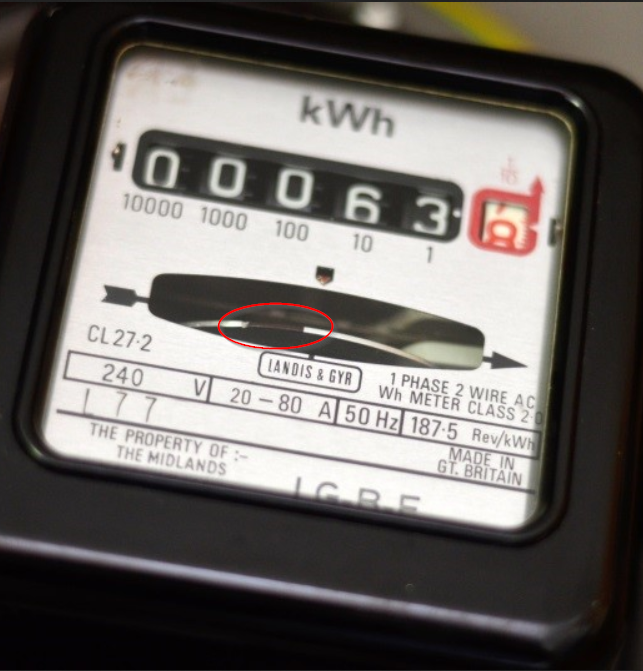
The YouLess in my case detects the little black stripe on the analog electricity meter, as shown in the below picture:
When I first got the YouLess, I placed it on the analog meter but after a few hours it missed pulses, the count didn't match the actual meter. After fiddling around to get a Windows 7 gadget installed on Windows 11 and re-aligning the YouLess a few times, it picked up all the pulses. The most time-consuming part was to get that Windows 7 gadget up and running, it crashes a lot. So I decided to write a bit of Qt/QML to make this experience better.
The use-case is limited since there are not a lot of analog meters here in The Netherlands, most households have had their electricity meter replaced for free with a so called Smart Meter (with a P1 port), a digital meter. But even with a very limited use case, who needs an excuse to write some line-graph code in JavaScript for QML using the Canvas API? After my recent experience of drawing a Circle in QML, I'm starting to like how easy it is to quickly draw custom shapes with it.
This post is not sponsored nor endorsed by YouLess. I wrote this app myself to help me align the device to the meter correctly using the open API they provide. I paid for the device myself.
You can download the Android app on the Google Play Store here and the source code is available under the GPLv3 here. On GitHub you'll also find a release APK if you do not want to use the Play Store.
YouLessQt
YouLessQt is written in C++ using Qt and QML, because that is what I currently
use most of the time for my cross-platform app development. It uses mostly QML,
It is nothing more than a Timer which does a JSON API call and plots a line
chart with some values.
The HTTP calls are done in QML using xmlhttpreqeust as I wrote on last year.
The API is described in the the YouLess manual. There is 1 api endpoint that has the raw lightsensor value. The documentation states not to use it for electricity data, but since my usecase is the raw value, I can safely ignore that message. I also request a few other data points such as the firmware version, model, mac address and the last 1 minute energy usage, but that request is done only once when connecting, not every 250ms.
The application also has a graph showing the most recent current power usage value and the value 1 minute before that. It however is not intended as a general YouLess application, since YouLess themselves provide a great app. If they added the raw light sensor value to that app instead of a Windows 7 gadget, I wouldn't have written this small app.
YouLessQt is available for Android in the Google Play Store since I suspect you'll be near your electricity meter when you are using this (fuse box). My computer is in my office, nowhere near my electricity meter, so a mobile app is way more useful. If you'd like a Windows build of YouLessQt, please send me an email, I'd happily build an installer if there is an interest for it.
YouLessQt is not intended as a replacement for the official YouLess app. It does not support selecting different inputs (like S0, Gas meter, etc) and it has no history. The only intended use case is when aligning the YouLess to you analog meter.
The Windows Gadget
YouLess provides a Windows 7 gadget named RawMon to monitor the specific value regarding the pulses. There is a workaround for modern Windows (10/11) but in my case that was very unstable and my computer is nowhere near my electricity meter.
Quoting YouLess support (translated to English):
In Belgium, analogue electricity meters are often housed in an additional (semi)transparent plastic casing. Is this the case for you as well?
As a result, the distance between Youless and the rotating disk is often greater than without the plastic casing. Due to the weaker signal, it is often necessary to adjust the sensitivity of the Youless device to accommodate this situation.
We have a Windows tool in the form of a Windows gadget that can visualize the reflection of the rotating disk in a graph. This tool is helpful for adjusting the sensitivity. You can download this tool here:
http://www.youless.nl/tl_files/downloads/rawmon-0.2.zip
If you are using Windows 8, the raw monitor gadget can be used with the 8gadget pack:
http://www.youless.nl/blogpost/items/gadget-windows-8.html
The Youless device is designed to count a dip in the reflected light intensity of approximately 45% as a pulse by default. With the Windows tool, the graph typically looks like this:
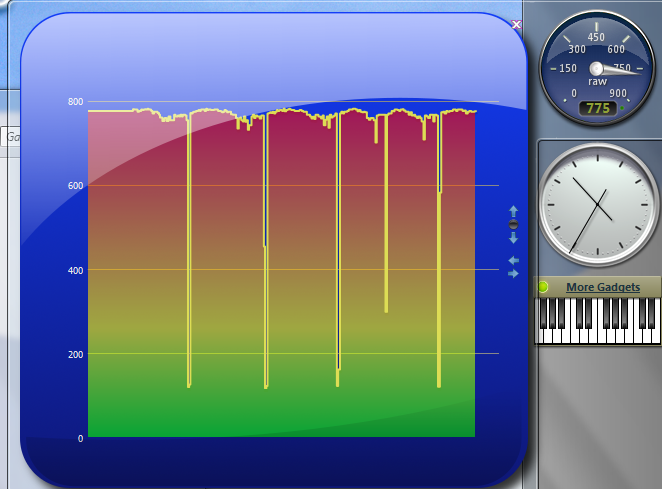
Tags: android , c++ , qml , qt , qt5 , smart-home , software , youlessThere is a clear, sharp dip in the signal when the bar passes by. The clearer the dip (relative), the better. If the average input level is low, it is not a problem as long as the dip is distinguishable.
This dip will be less clear due to the increased distance if there is an additional plastic casing. The threshold parameter "lw" can be adjusted by entering the following URL in a browser (replace the example IP address 1.2.3.4 with your own Youless IP address):
http://1.2.3.4/M?lw=105
What this means is that with "lw" set to 105, the Youless device will consider a dip of 100/105=0.95 (or a 5% relative decrease) from the average reflection level as a pulse. The default factory value of "lw" is 180, so setting it to 105 increases sensitivity significantly. The "lw" value must be at least 101.
The suggested parameter value of 105 usually works well for meters in an additional plastic casing. From the reflection graph, you can derive the optimal value for "lw" if needed.